class: center, middle, inverse, title-slide # Regional Disparities in Educational Outcome, Spatial Spill-over, and the Determinants ## Evidence from 34 Provinces in Indonesia ### Ragdad Cani Miranti <br /><br />BPS- Central Bureau Statistics of Indonesia <br /> ### Prepared for 2021 Asian Seminar in Regional Science <br />October 8th 2021<br />[slides available at: <a href="https://asrs-slides-2021.netlify.app/#1" class="uri">https://asrs-slides-2021.netlify.app/#1</a>] --- ## Motivation: - Regional disparities in educational outcomes still persist - Financial resources have been intensified - Government of Indonesia implemented the rule of 20 percent budgeting for educational funds. - There are relative few studies that evaluate the role of spatial effects on the educational process. - Lack of academic literature on educational development at the sub-national level in Indonesia. ## Research Question: - Does role of neighborhood effect exist in altering the educational outcomes between proximate provinces? - What are the significant variables affecting the educational outcomes across provinces? - How is the magnitude of those variables and spill-over effects to the educational outcomes across provinces? ## Methods: - Spatial autocorrelation (Moran's I and LISA) - Spatial Panel Models (SAR,SEM,SAC,SDM region-fixed effect) --- class: middle ## Main Results: 1. **Significant Spatial Autocorrelation** at the province level. 2. **Spatial model** - Spatial Durbin Model is the best specification model - Number of educational institutions and pupil-teacher ratio are two key factors affecting educational outcomes across provinces in Indonesia - Number of educational institutions (elementary school and senior high school) have indirect effect to the educational outcome. 3. **Policy Implication** - Increasing spatially better coordination and cooperation on educational development connectivity between local governments especially in the Eastern part and outer islands - Improving educational infrastructures --- class: middle # Outline of this presentation 1. **Introduction** and **Data** 2. **Spatial autocorrelation** - Moran's I Scatter Plot - Local Indicators of Spatial Autocorrelation 3. **Spatial Panel Model ** - Cross-sectional dependence test in the panel data - OLS Fixed Effect vs Some Spatial Panel Model with Region Fixed-Effect - Direct and Indirect Effect 4. **Concluding Remarks** <br /> <br /> [ Slides and paper available at: https://asrs-slides-2021.netlify.app/#1] --- class: center, middle # (1) Some stylized facts **Educational Outcome disparities across districts over time ** **Educational Outcome disparities across islands over time** --- class: middle,center #Disparities in mean years of schooling across districts over time  **Note: X-axis reflects mean years of schooling, Y-axis reflects expected years of schooling, human development index is reflected by the dot size and name of island is reflected by the dot color** --- class: middle,center # Violin Chart of Mean Years Schooling Dispersion across Islands in Indonesia 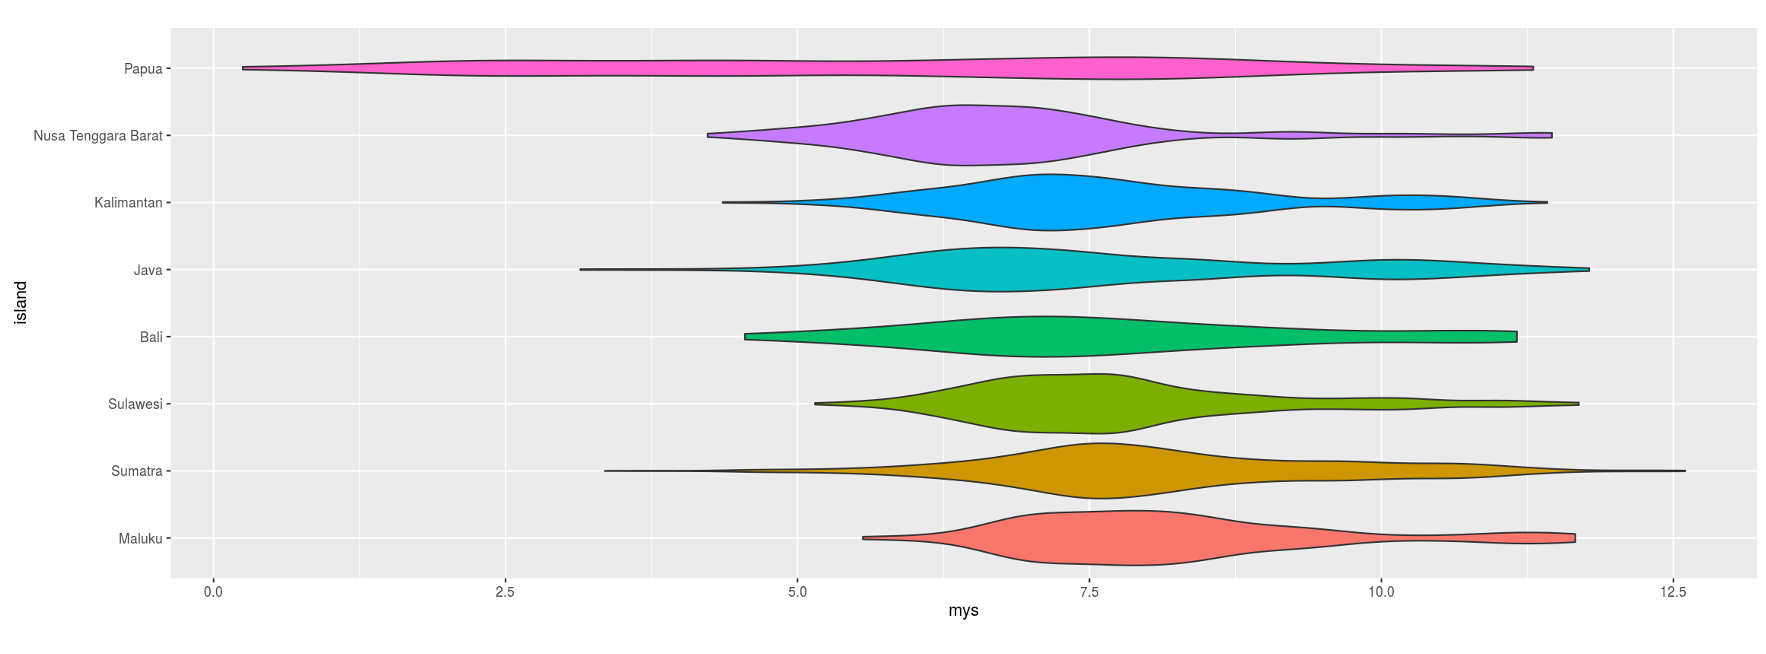 --- class: middle,center # (1) Data **Mean years of schooling 2010-2018 at province level** **Expected years of schooling 2010-2018 at province level** **Number of elementary schools, junior high schools, and senior high schools 2010-2018 at province level** **Pupil-teacher ratio in elementary school, junior high school, and senior high school** **All data are derived from Central Bureau Statistics of Indonesia (BPS-Statistics Indonesia)** --- class: middle # (3) Spatial Autocorrelation Global Spatial Autocorrelation : Moran's I Statistics Local Indicators of Spatial Autocorrelation (LISA) --- class: middle, center # Global spatial Autocorrelation ## Mean Years of Schooling 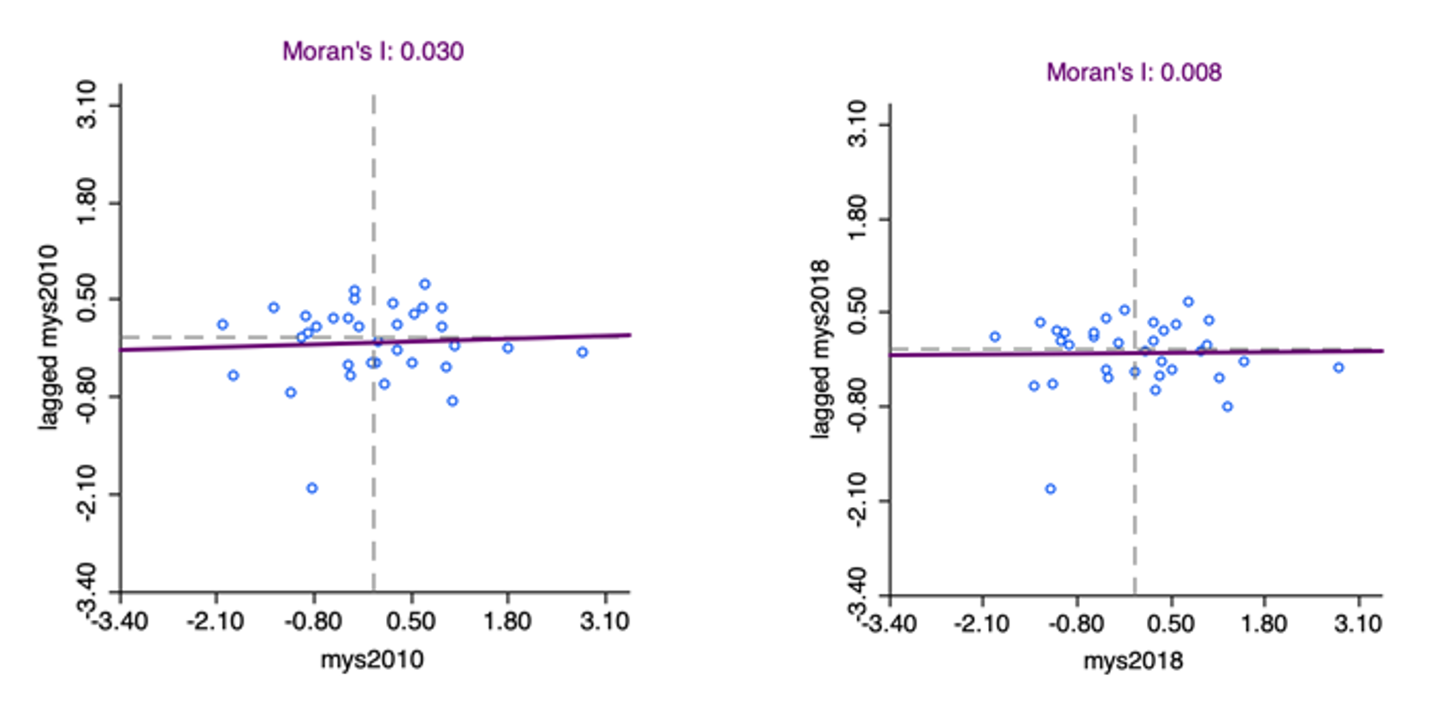 Global spatial autocorrelation is measured based on the Moran’s I, which is statistically significant at 5% level for all years. --- class: middle, center ## Expected Years of Schooling 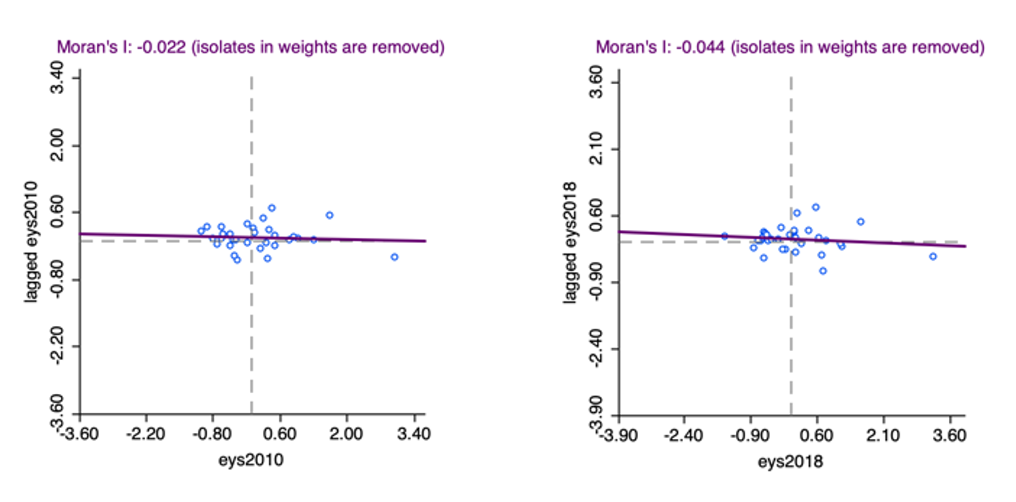 --- class: middle, center # Local Indicators of Spatial Autocorrelation (LISA) ## Mean Years of Schooling Initial period (2010) <img src="lisamys2010.png" style="width: 75%" /> **Note** : Local spatial dependence is significant for both spatial clusters and spatial outliers at 5% significance level --- class: middle, center # Local Indicators of Spatial Autocorrelation (LISA) ## Mean Years of Schooling Initial period (2018) <img src="lisamys2018.png" style="width: 75%" /> **Significant cold-spot (spatial cluster with low mean years of schooling surrounded by low mean years of schooling-cluster) located in Papua Province. --- class: middle, center # Local Indicators of Spatial Autocorrelation (LISA) ## Expected Years of Schooling Initial period (2010) <img src="eyslisa2010.png" style="width:75%" /> **Note** : Local spatial dependence is significant for both spatial clusters and spatial outliers at 5% significance level --- class: middle, center # Local Indicators of Spatial Autocorrelation (LISA) ## Expected Years of Schooling Initial period (2018) <img src="eyslisa2018.png" style="width:75%" /> Spatial outlier high-low (spatial cluster with relatively high expected years of schooling surrounded by relatively low expected years of schooling cluster) is only significant in Maluku Province. --- class: middle, center # Some Spatial Panel Models  --- class: middle, center # Cross-sectional dependence test in the panel data model ## Pesaran Test for Model of Mean Years of Schooling  ## Pesaran Test for Model of Expected Years of Schooling 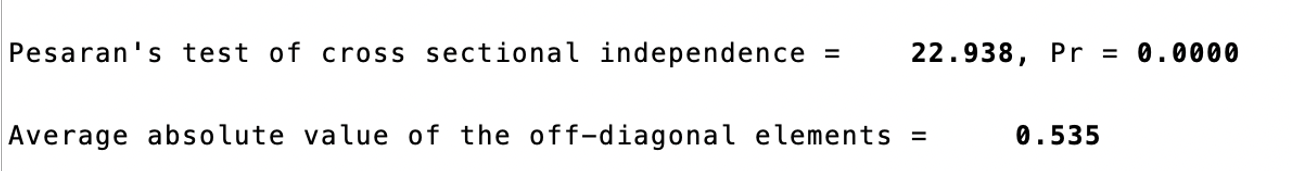 --- class: middle # Spatial Panel Models for Mean Years of Schooling ## Spatial Pane Model with Region Fixed-Effect 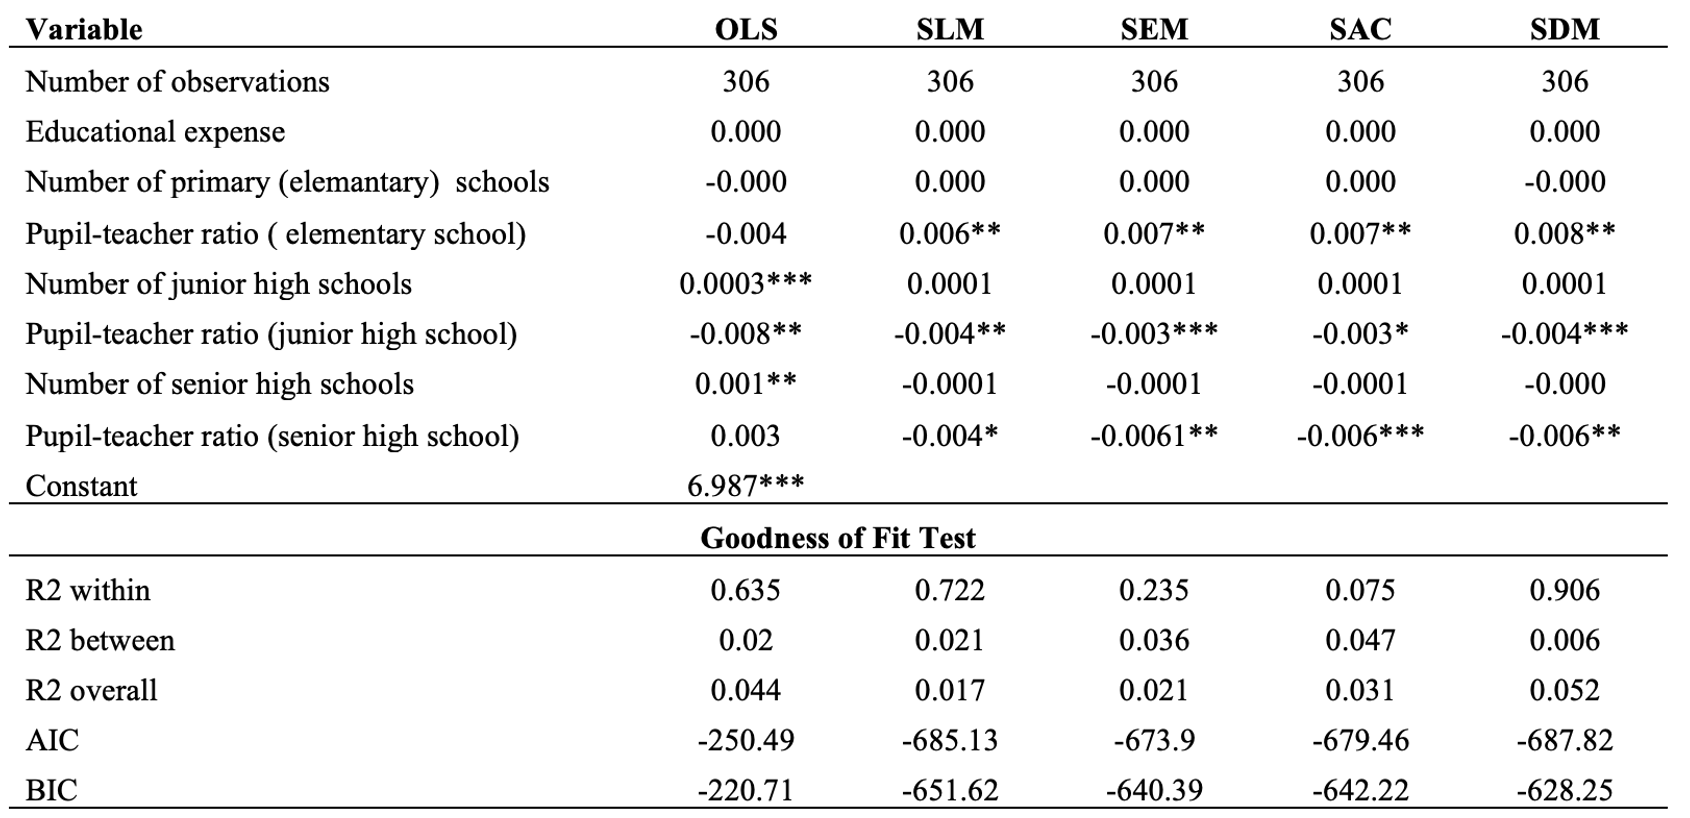 --- class: middle # Spatial Autocorrelation Parameter 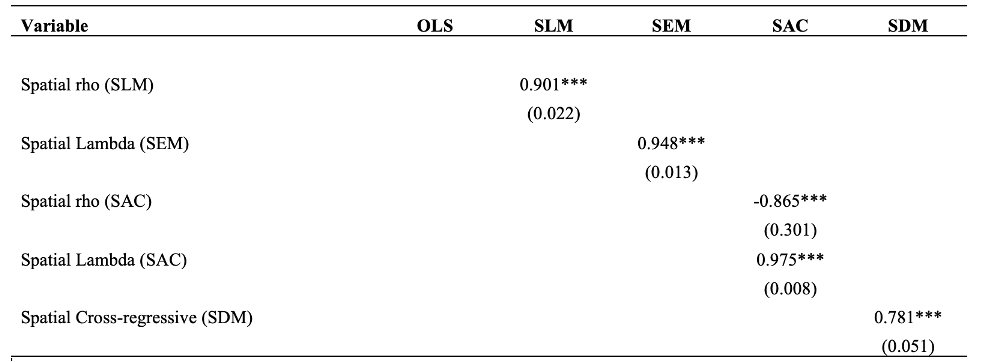 --- class: middle # Spatial Panel Models for Expected Years of Schooling ## Spatial Panel Model with Region Fixed-Effect 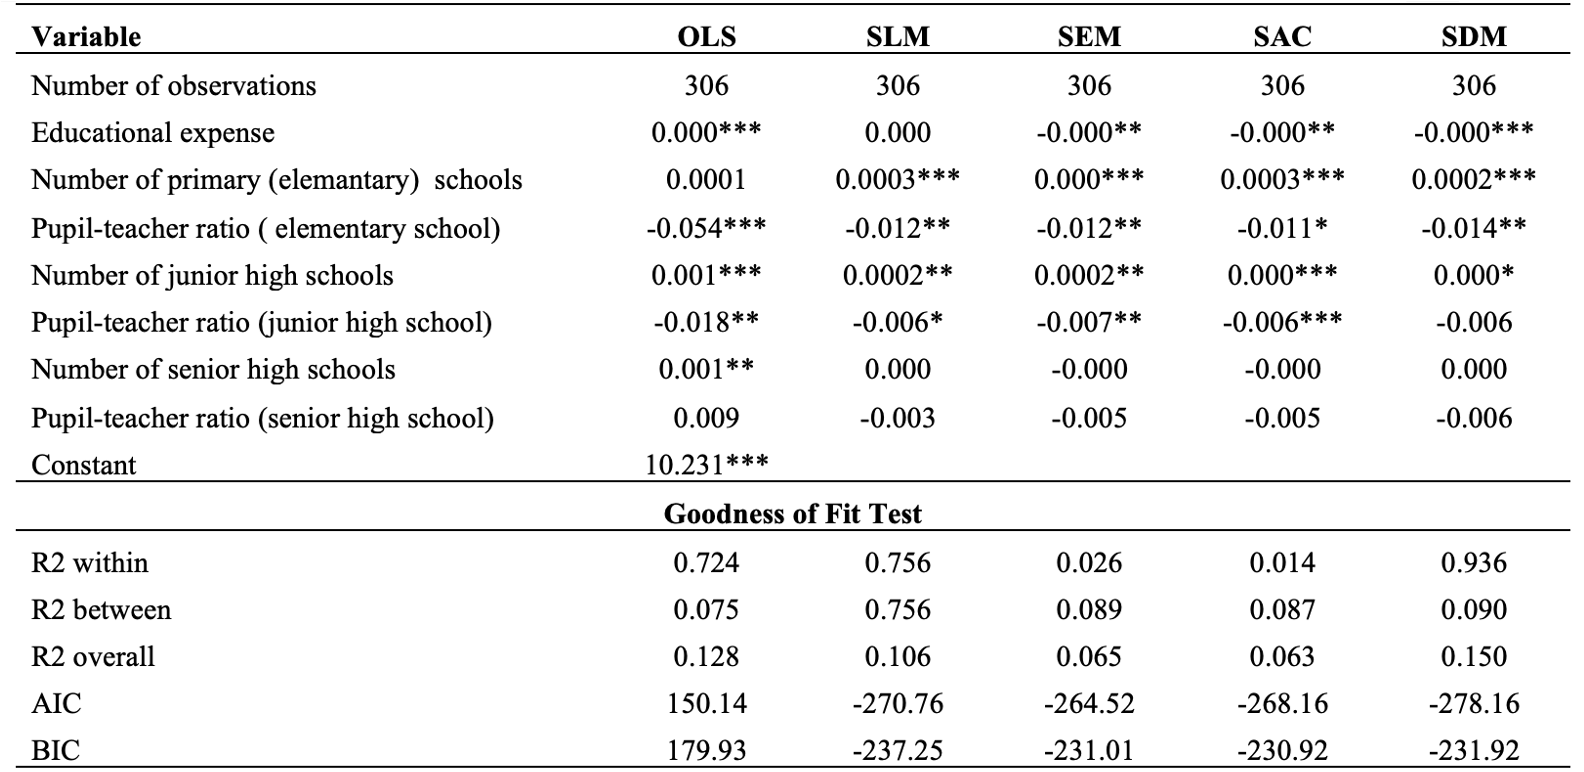 --- class: middle # Spatial Autocorrelation Parameter 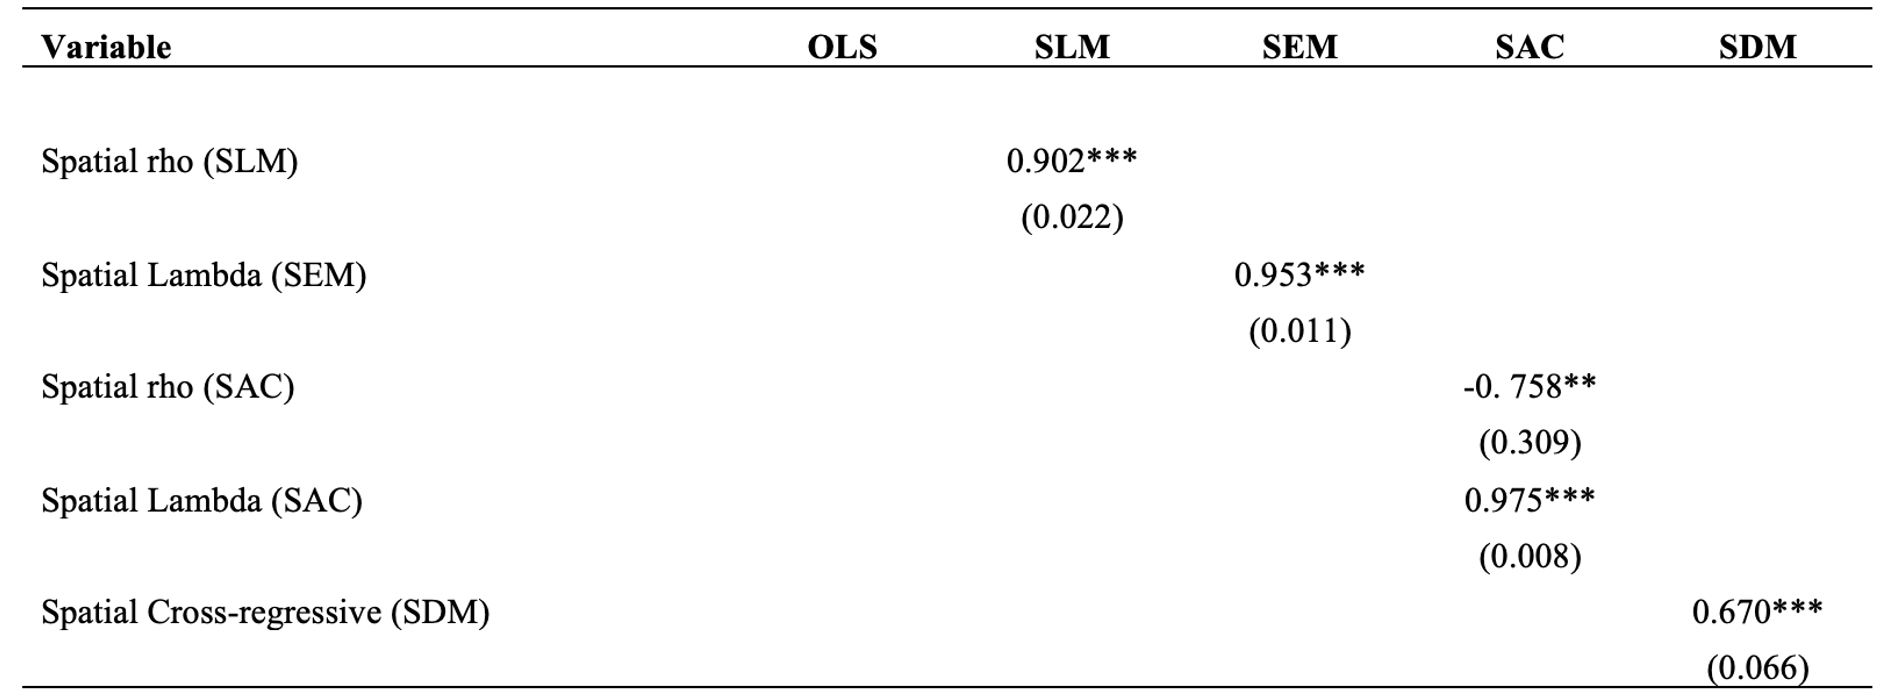 --- class: middle #Direct and Indirect Effect ## Mean Years Schooling <img src="definition.png" style="width:50%" /> <img src="myslr.png" style="width:75%" /> --- class: middle #Direct and Indirect Effect ## Expected Years of Schooling 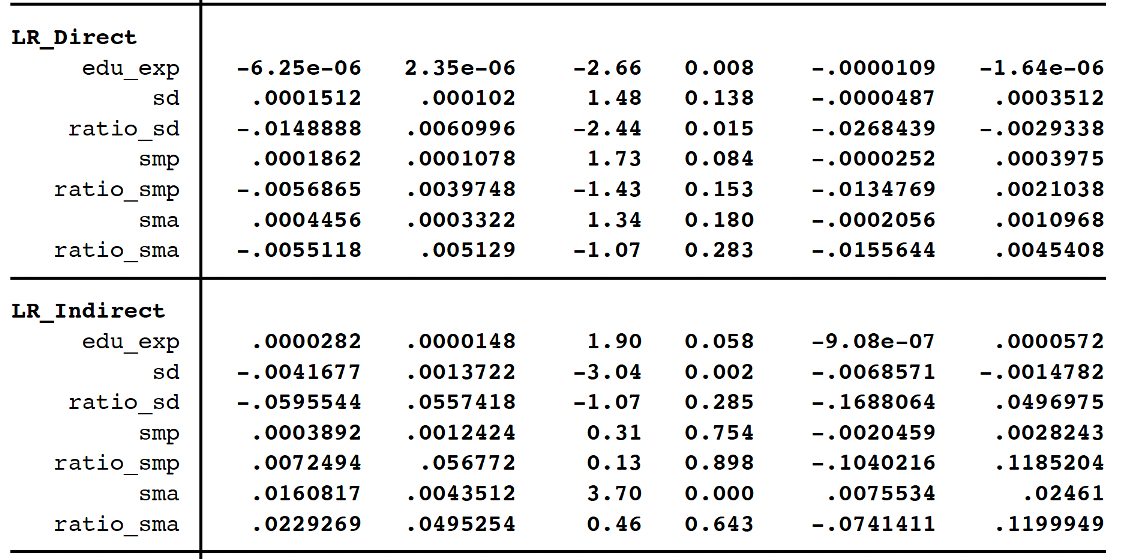 --- class: center, middle # (5) Concluding Remarks - **Inequality still matters**. Eastern part of Indonesia need to be the priority of educational development. - The availability of educational institutions in each level and the pupil-teacher ratio are vital factors to improve the educational outcomes in Indonesia. - **Spill-over effect does exist**. The indirect effect of availability of schools to the mean years of schooling and expected years of schooling is positive and significant. - --- class: center, middle # Thank you very much for your attention Slides and working paper available at: https://asrs-slides-2021.netlify.app/#1]  **Quantitative Regional and Computational Science lab** https://quarcs-lab.rbind.io ***