Disparities in mean years of schooling across districts over time
 Note: X-axis reflects mean years of schooling, Y-axis reflects expected years of schooling, human development index is reflected by the dot size and name of island is reflected by the dot color
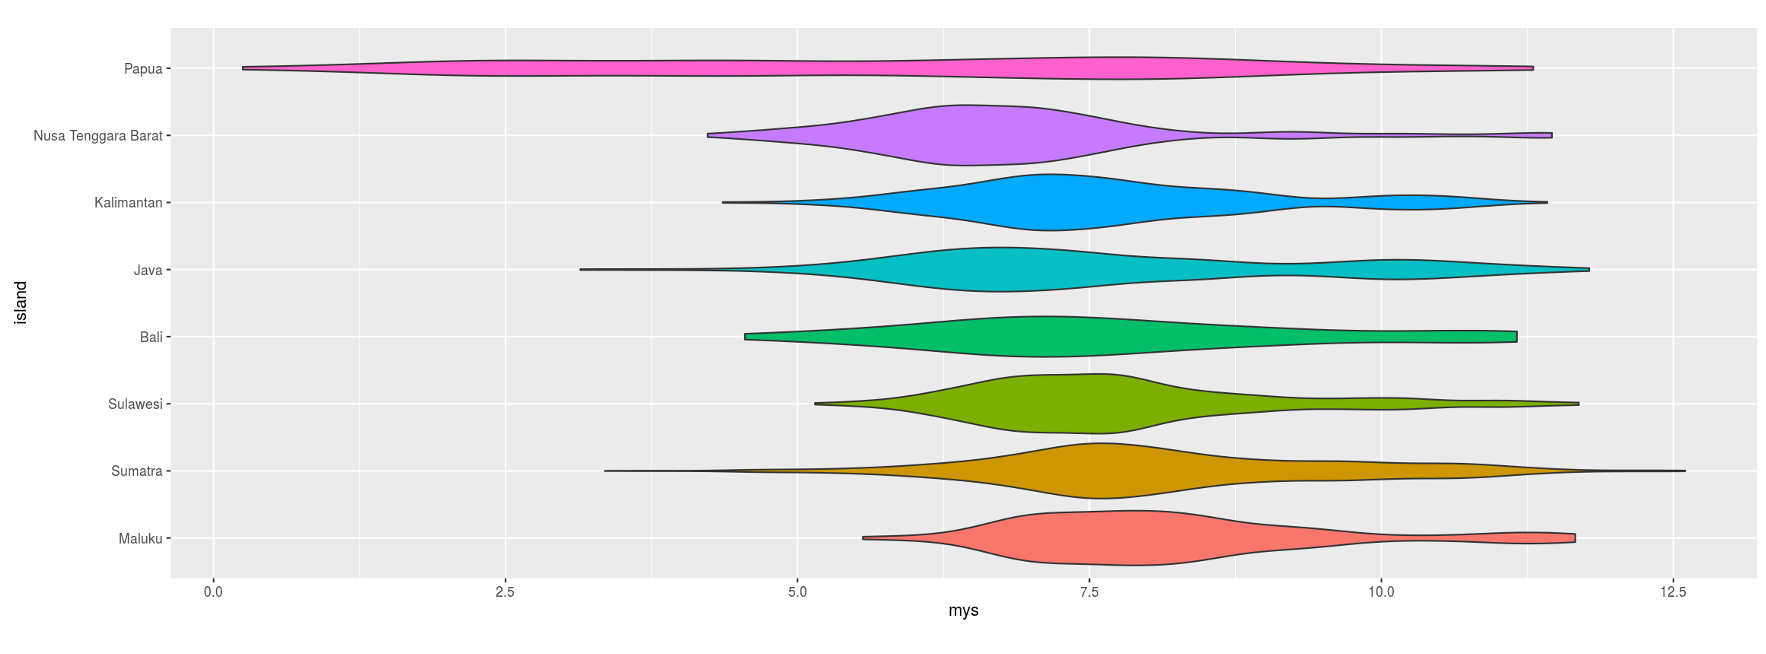
Violin Chart of Mean Years Schooling Dispersion across Islands in Indonesia
Global spatial Autocorrelation
Mean Years of Schooling
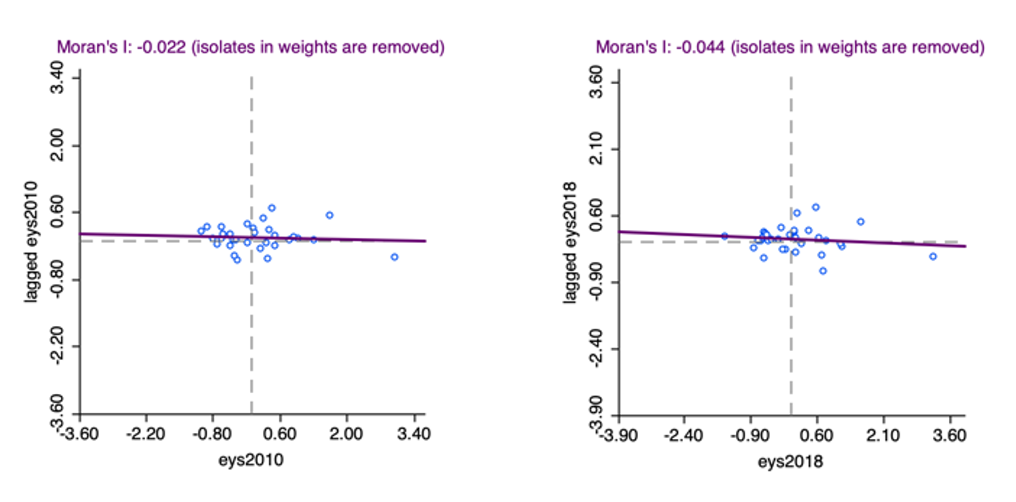
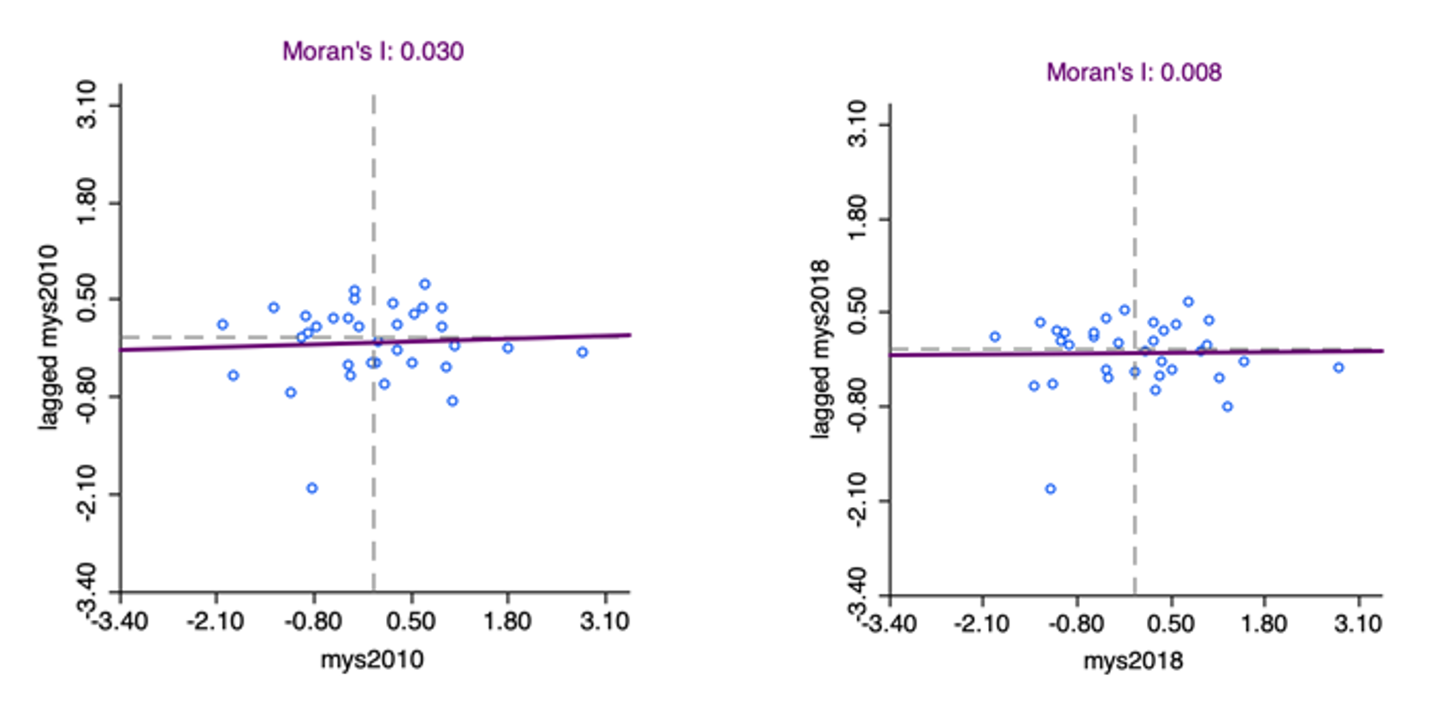 Global spatial autocorrelation is measured based on the Moran’s I, which is statistically significant at 5% level for all years.
Expected Years of Schooling
Local Indicators of Spatial Autocorrelation (LISA)
Mean Years of Schooling Initial period (2010)
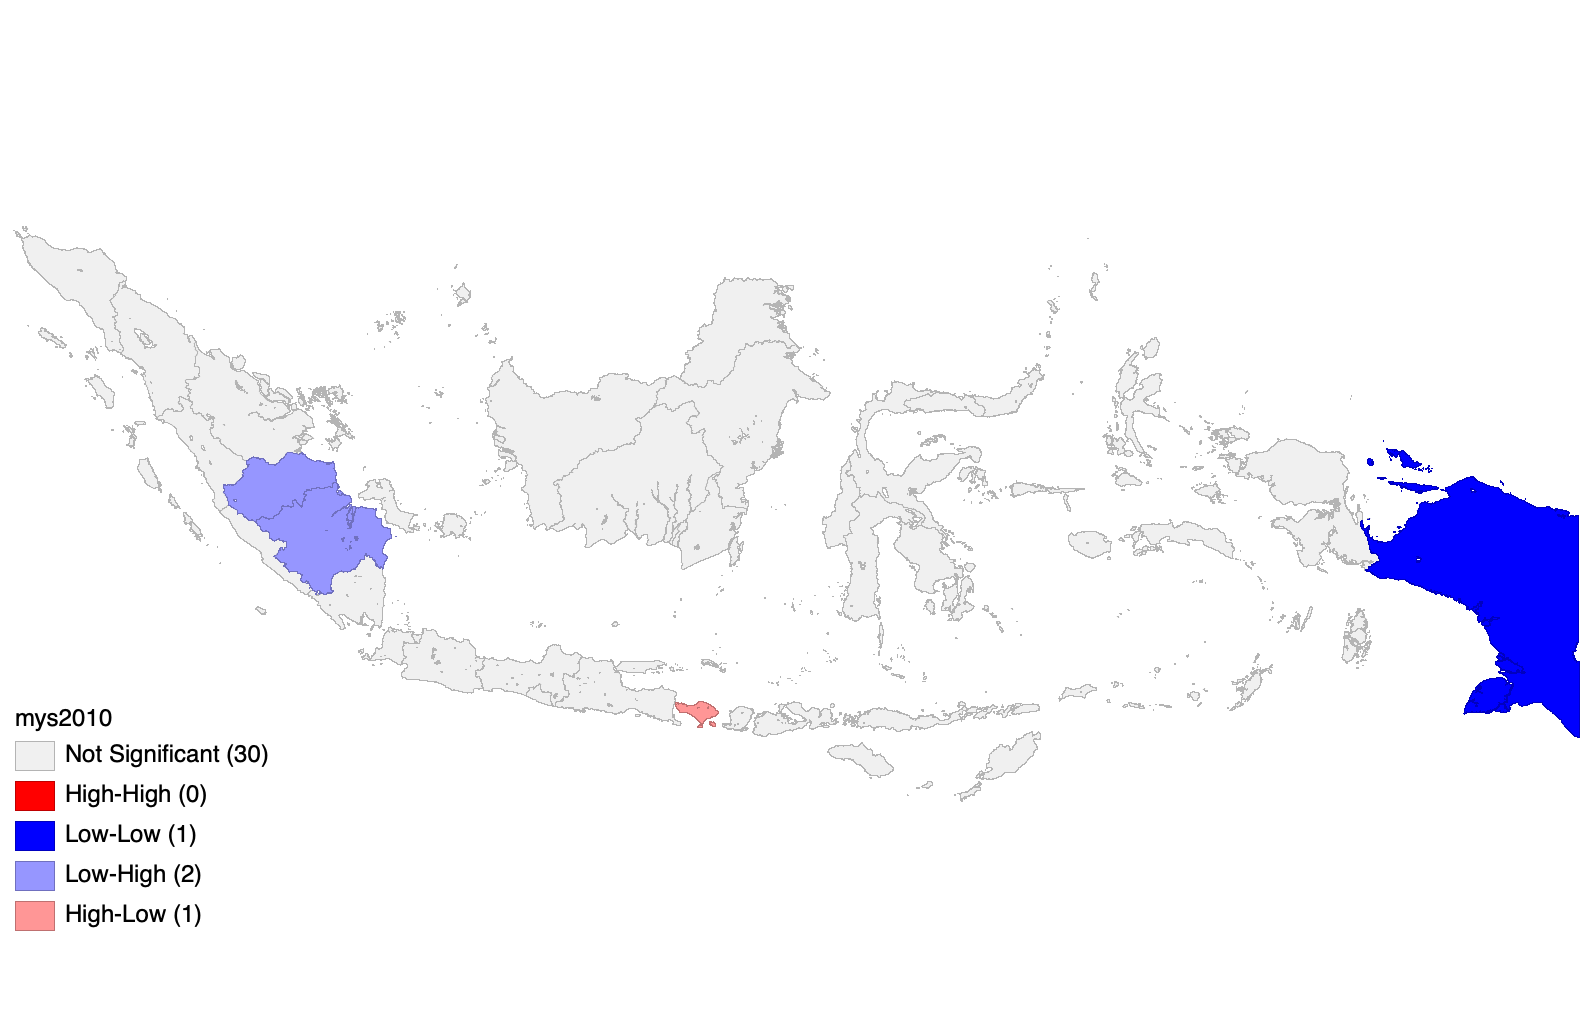
Note : Local spatial dependence is significant for both spatial clusters and spatial outliers at 5% significance level
Local Indicators of Spatial Autocorrelation (LISA)
Mean Years of Schooling Initial period (2018)
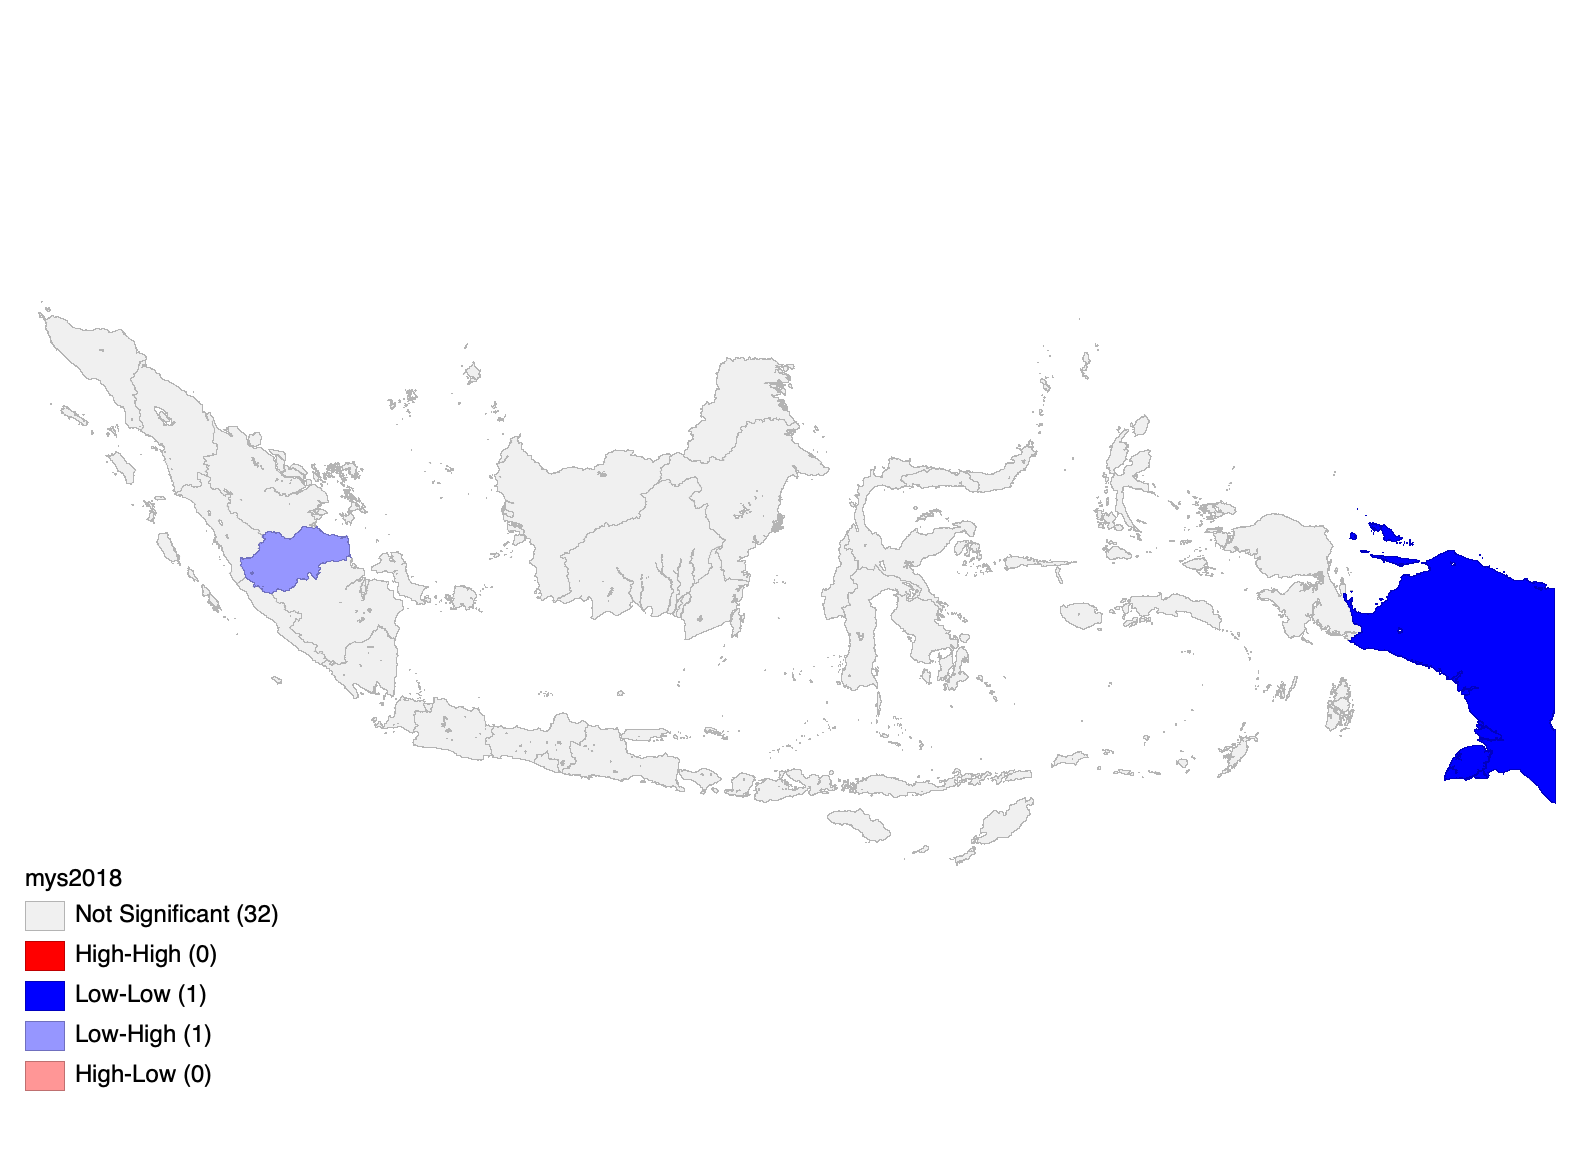
**Significant cold-spot (spatial cluster with low mean years of schooling surrounded by low mean years of schooling-cluster) located in Papua Province.
Local Indicators of Spatial Autocorrelation (LISA)
Expected Years of Schooling Initial period (2010)
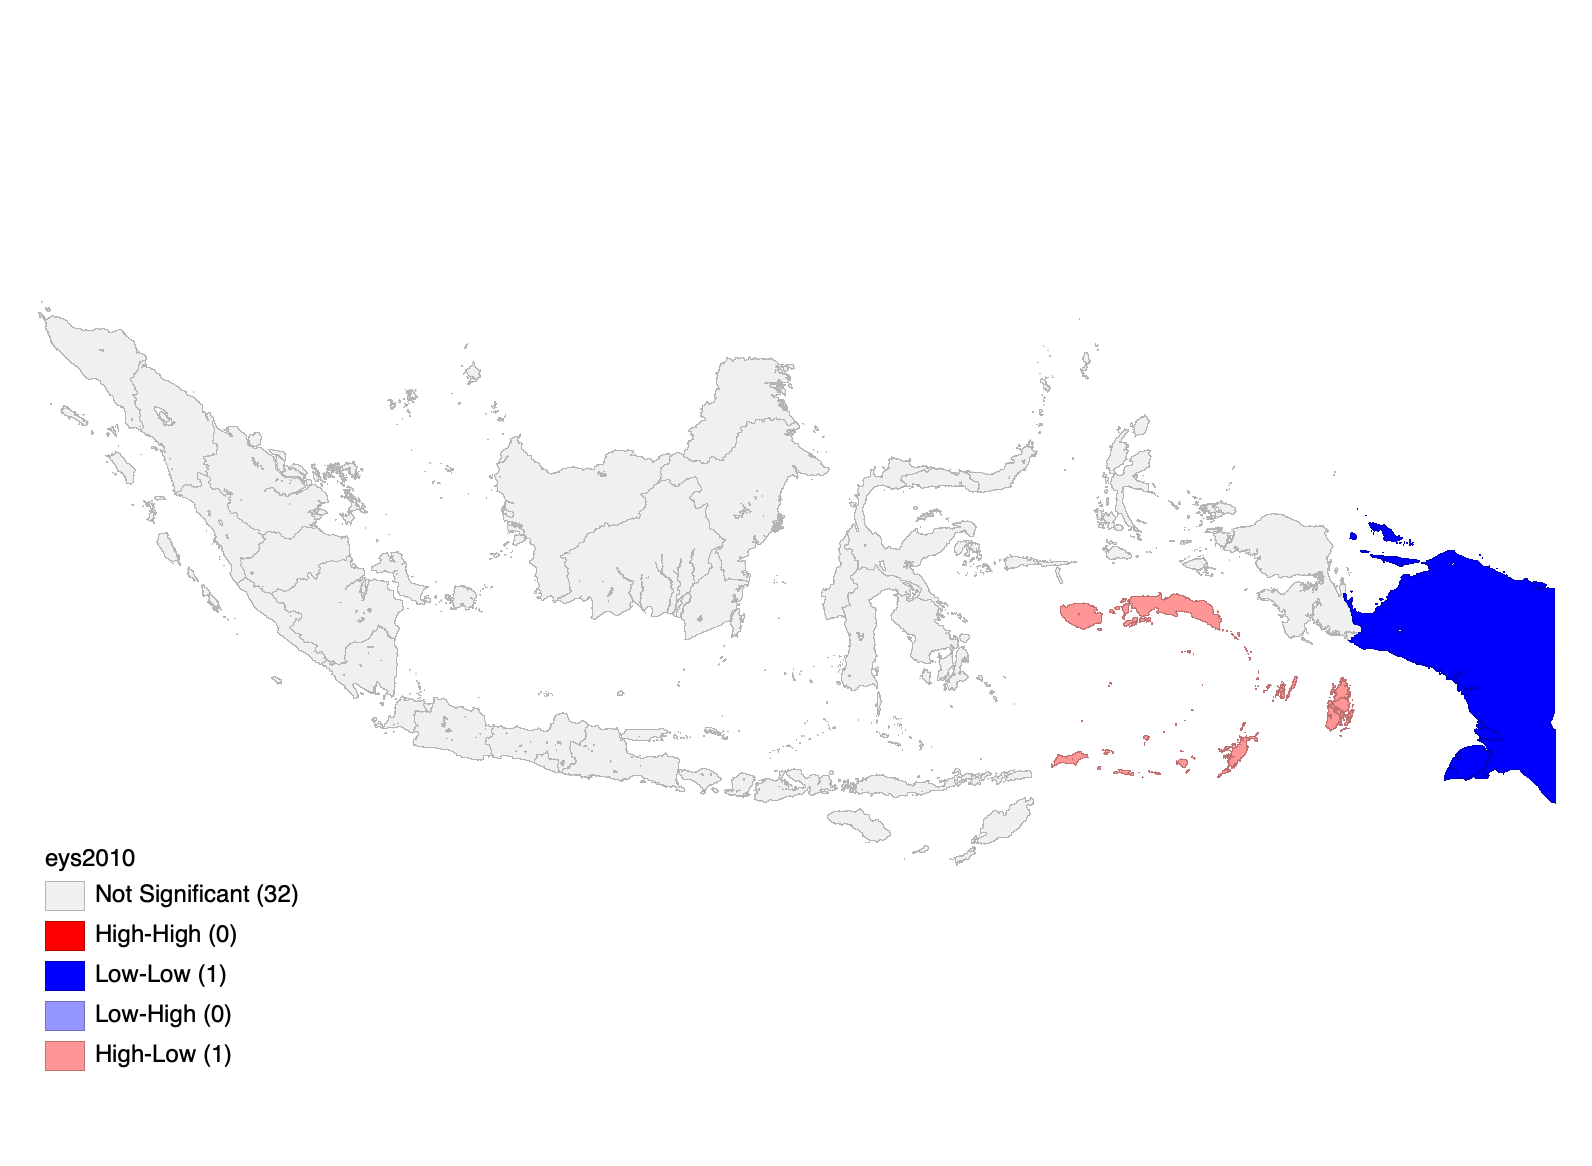
Note : Local spatial dependence is significant for both spatial clusters and spatial outliers at 5% significance level
Local Indicators of Spatial Autocorrelation (LISA)
Expected Years of Schooling Initial period (2018)
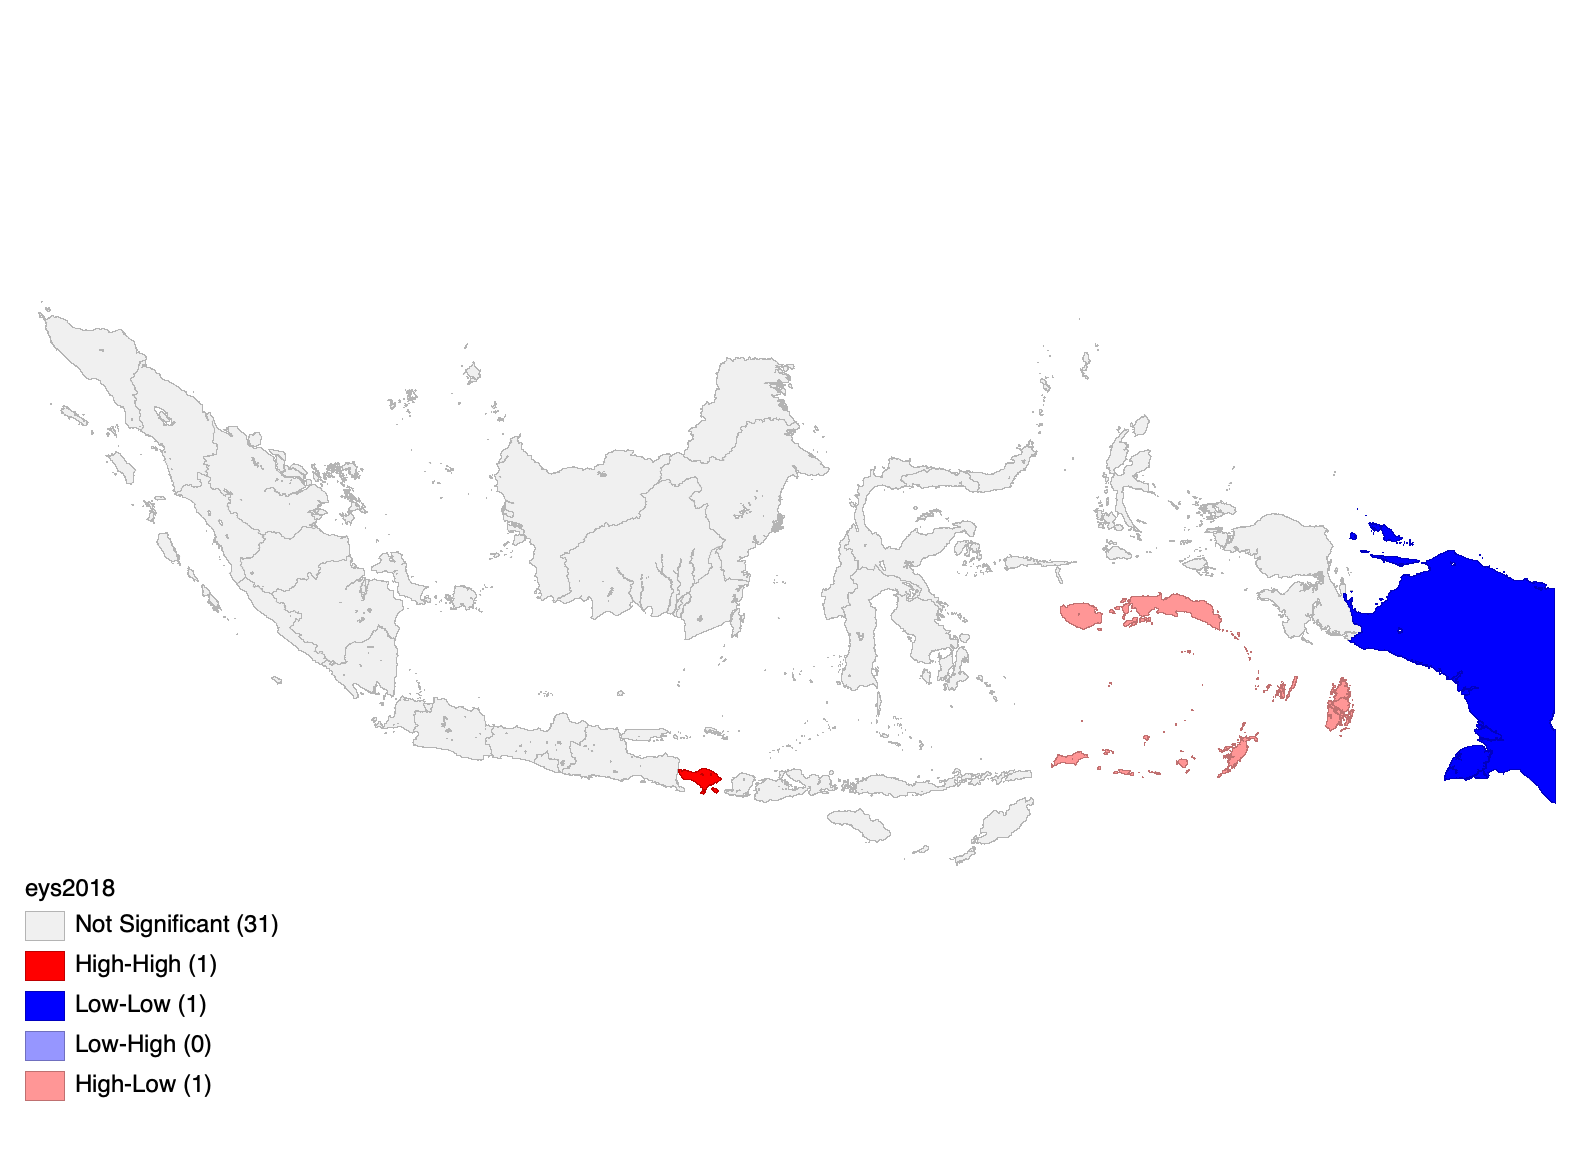
Spatial outlier high-low (spatial cluster with relatively high expected years of schooling surrounded by relatively low expected years of schooling cluster) is only significant in Maluku Province.
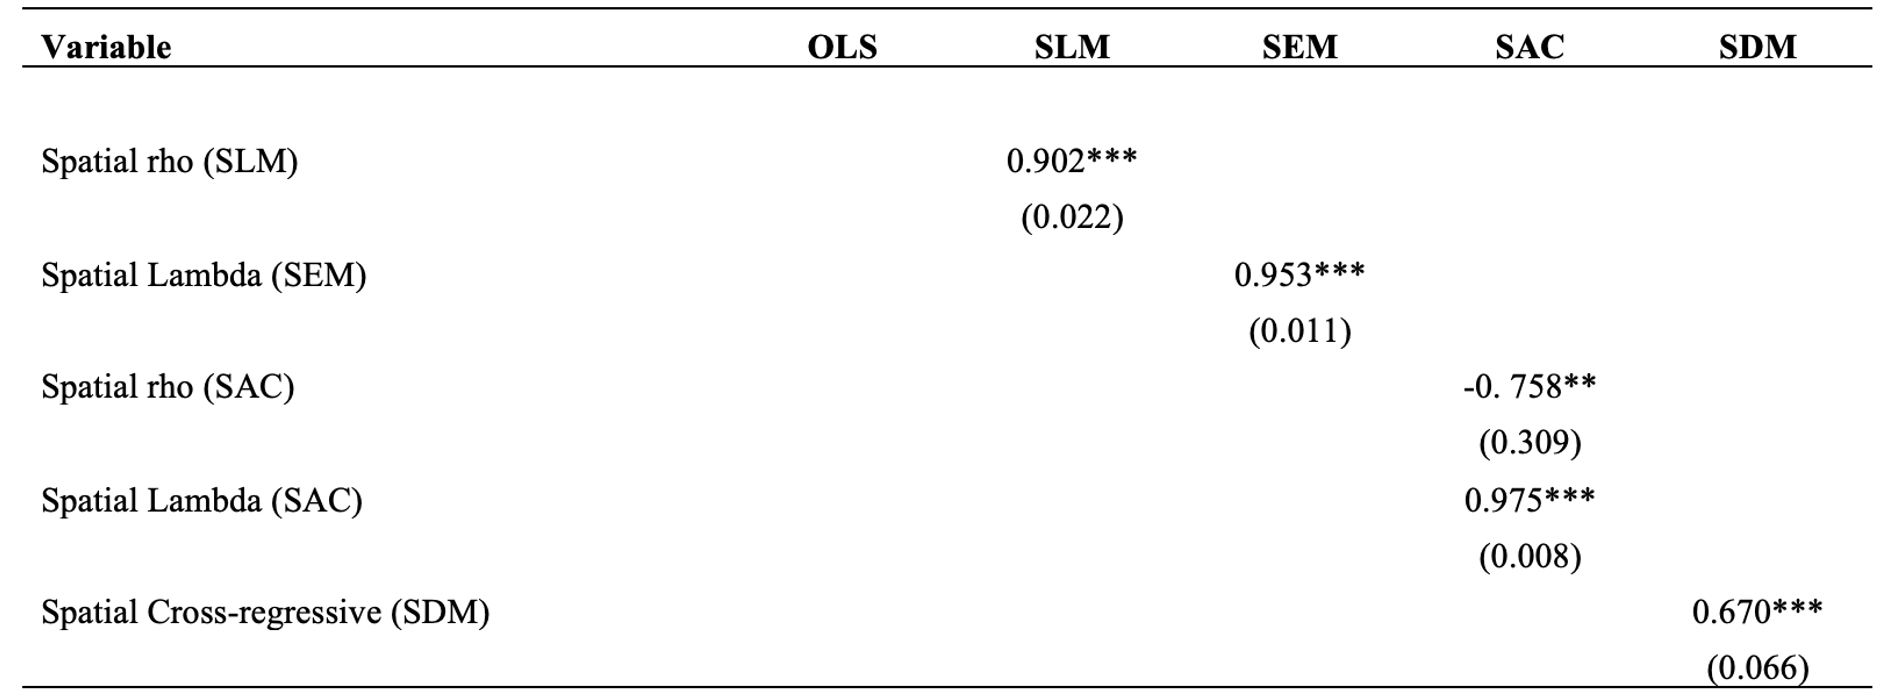
Some Spatial Panel Models

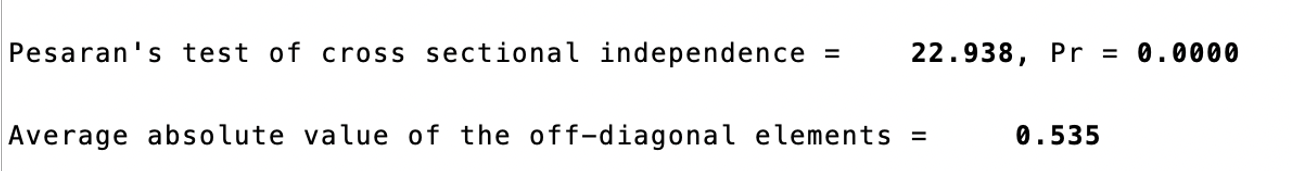
Cross-sectional dependence test in the panel data model
Pesaran Test for Model of Mean Years of Schooling
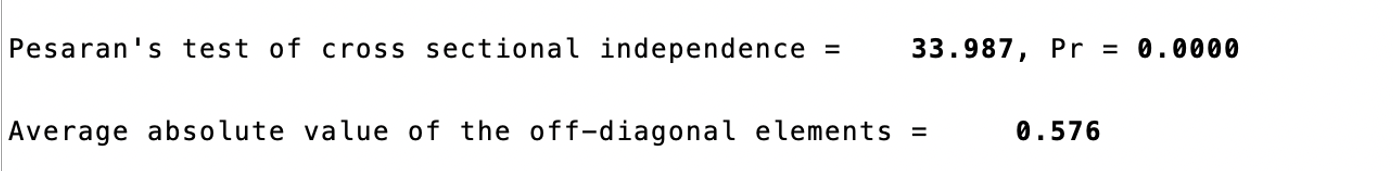
Pesaran Test for Model of Expected Years of Schooling
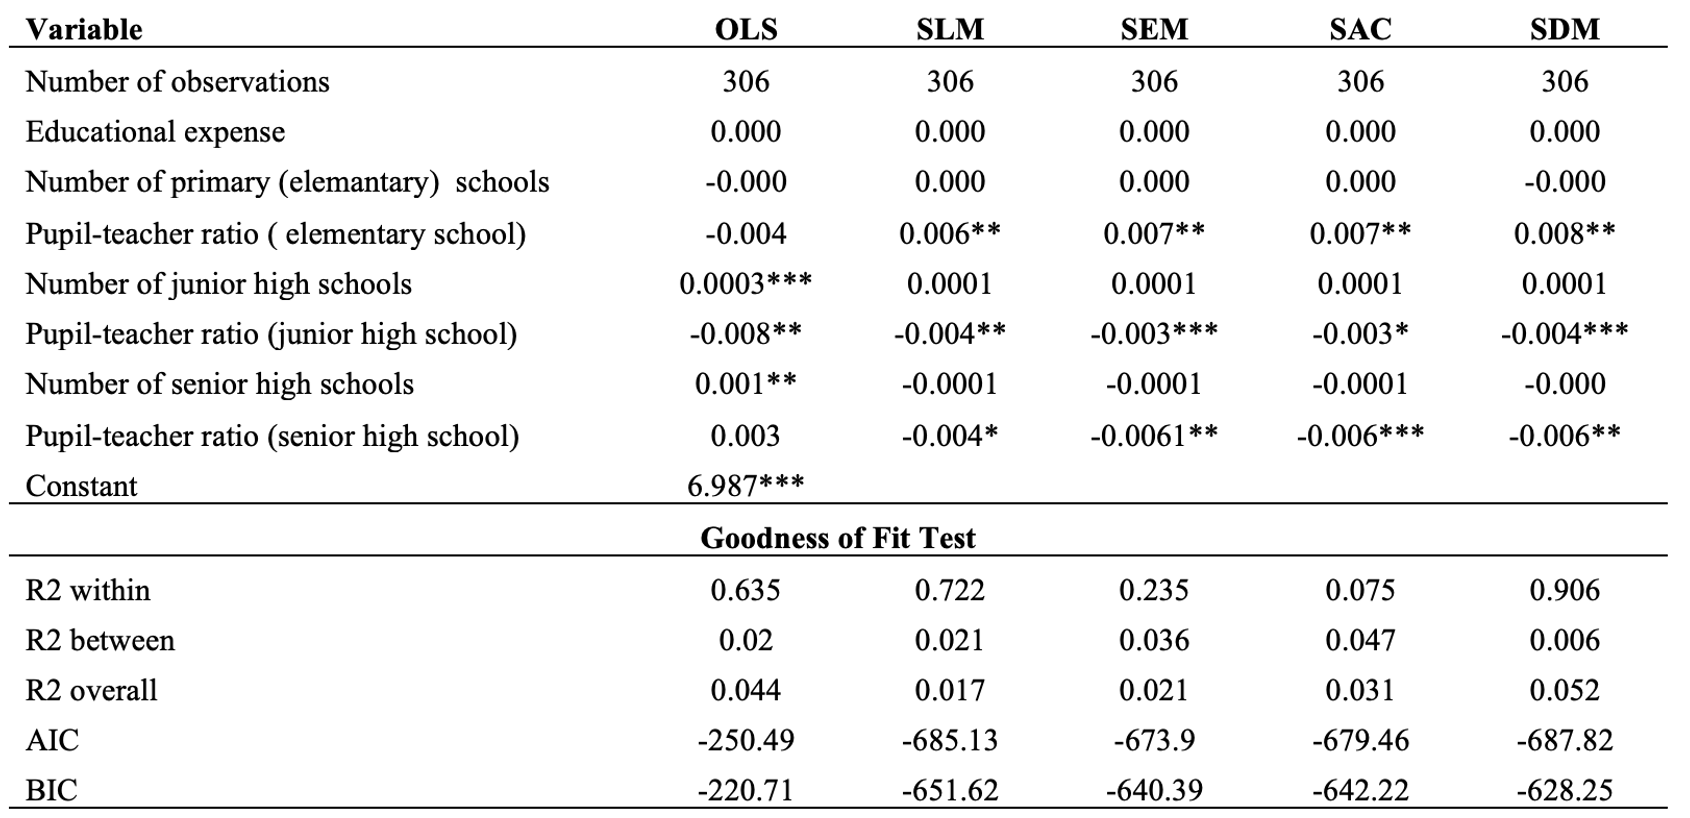
Spatial Panel Models for Mean Years of Schooling
Spatial Pane Model with Region Fixed-Effect
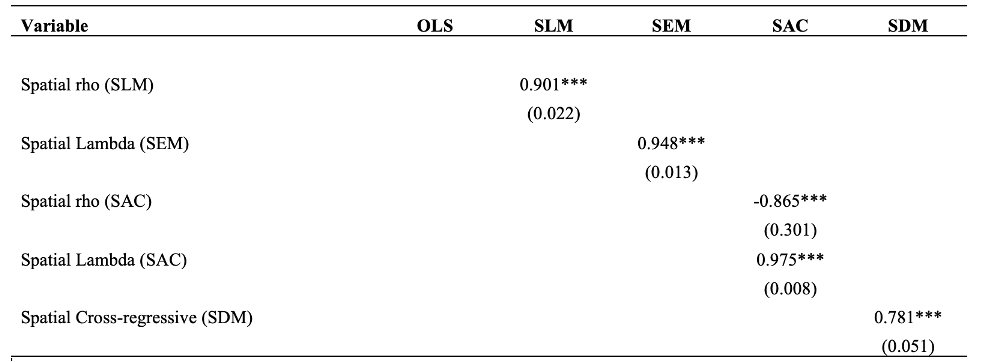
Spatial Autocorrelation Parameter
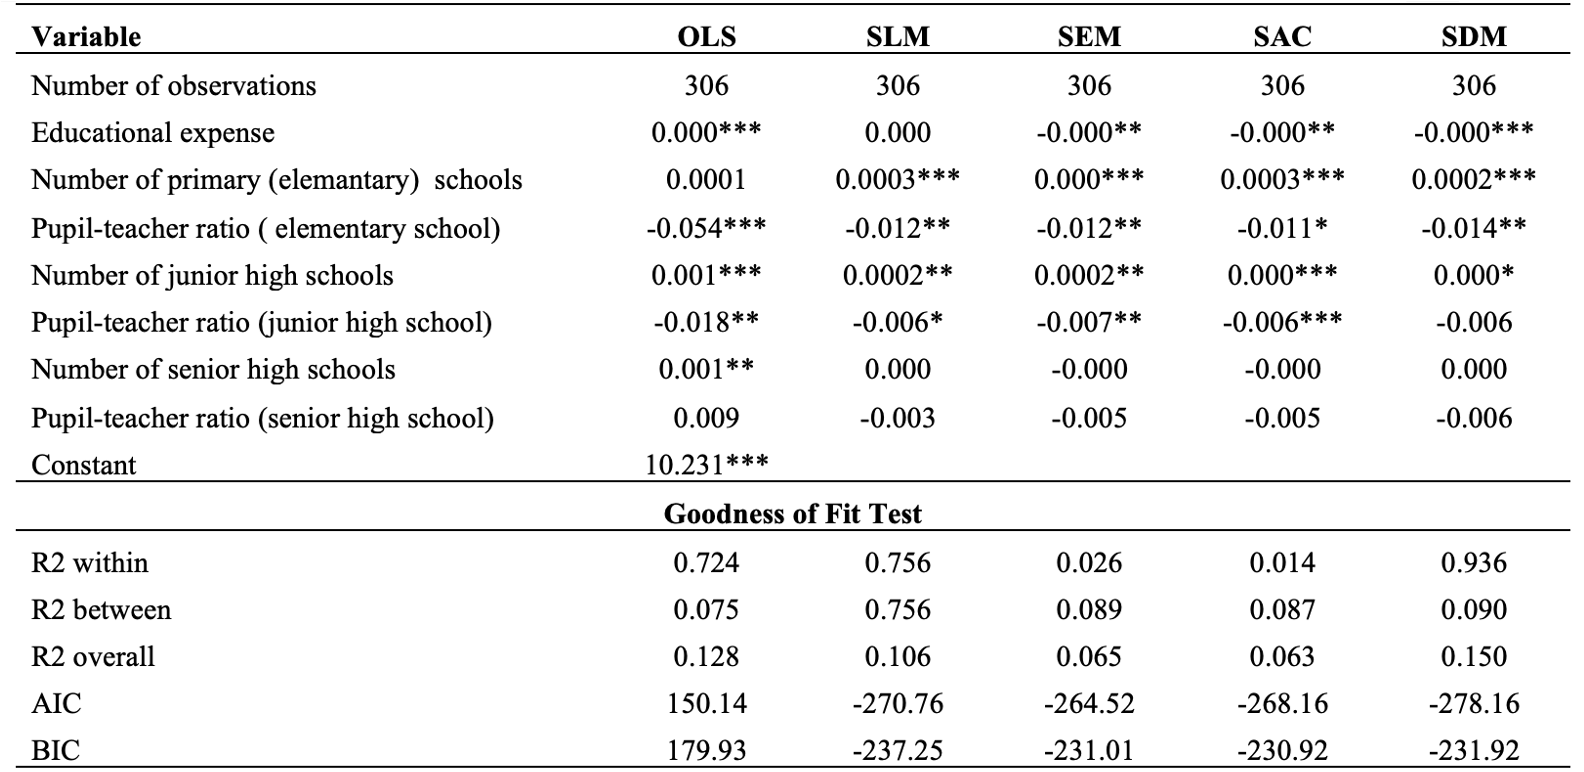
Spatial Panel Models for Expected Years of Schooling
Spatial Panel Model with Region Fixed-Effect
Spatial Autocorrelation Parameter
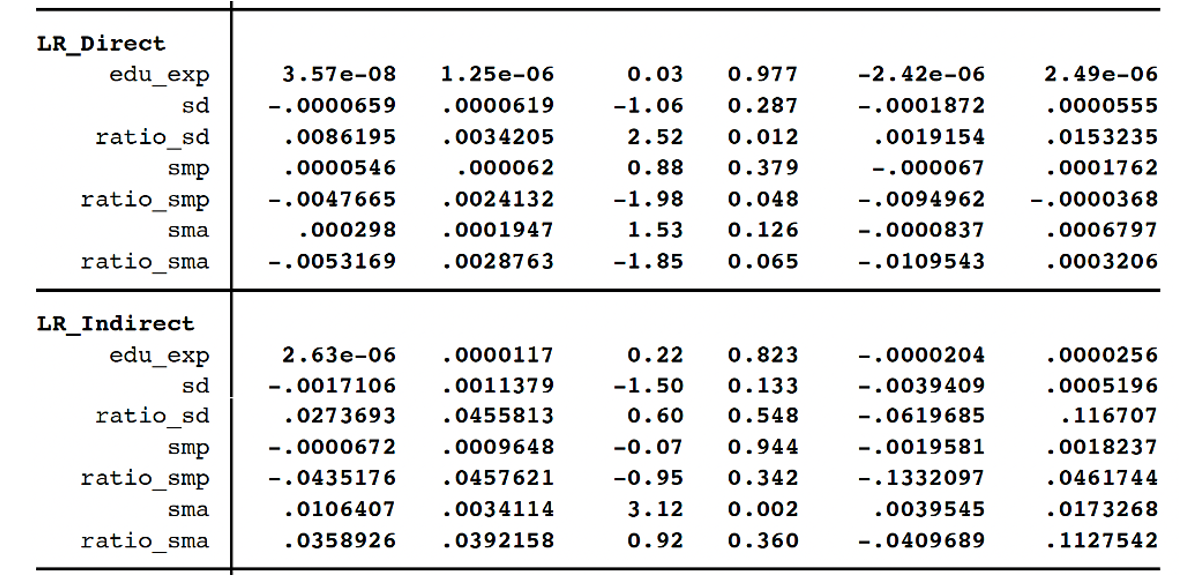
Direct and Indirect Effect
Mean Years Schooling
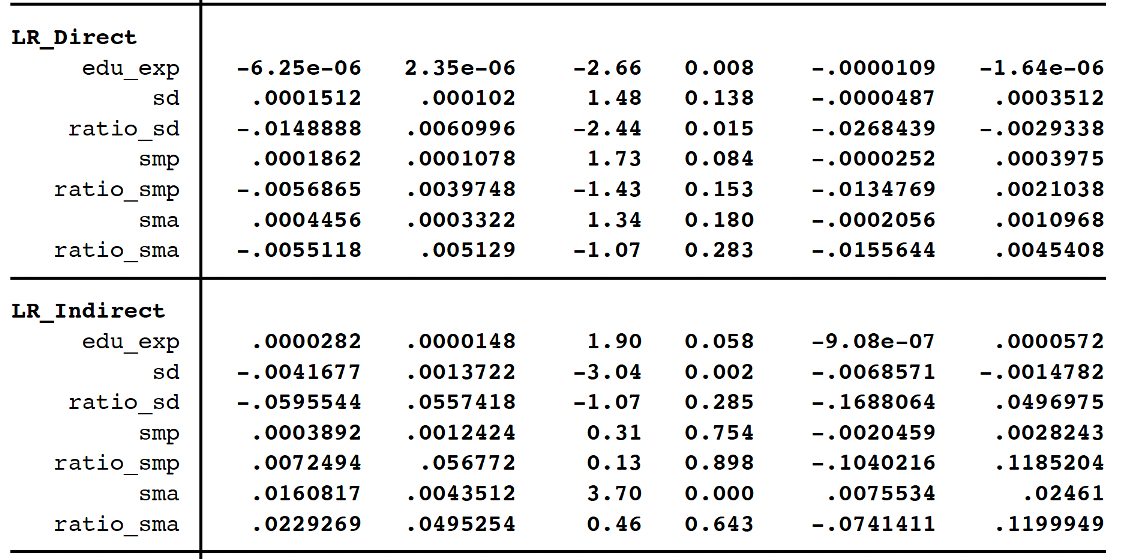
Direct and Indirect Effect
Expected Years of Schooling
Thank you very much for your attention
Slides and working paper available at: https://asrs-slides-2021.netlify.app/#1]
![]()
Quantitative Regional and Computational Science lab